
Picture this: after weeks of intensive work, a dedicated team of Looker developers have crafted...
To better measure financial performance across departments, our client asked us to create a dashboard in Power BI that displays year-over-year general ledger (GL) account balances, using the GL data they have stored within Microsoft Dynamics GP. This seemed simple enough, but turns out tables using Dynamics GP datasets require a lot of data manipulation to produce helpful visualizations in Power BI. I’ve provided the methodology we used to optimize Dynamics GP data to produce an intuitive table for creating a GL account summary dashboard.
Creating an Efficient Table to Load Into PowerBI
I started with this resource to first create a GL account summary table that includes the Dynamics GP datasets I wanted in my table: the beginning balance, ending balance, and net change throughout the months.
Typical GL Trial Balance
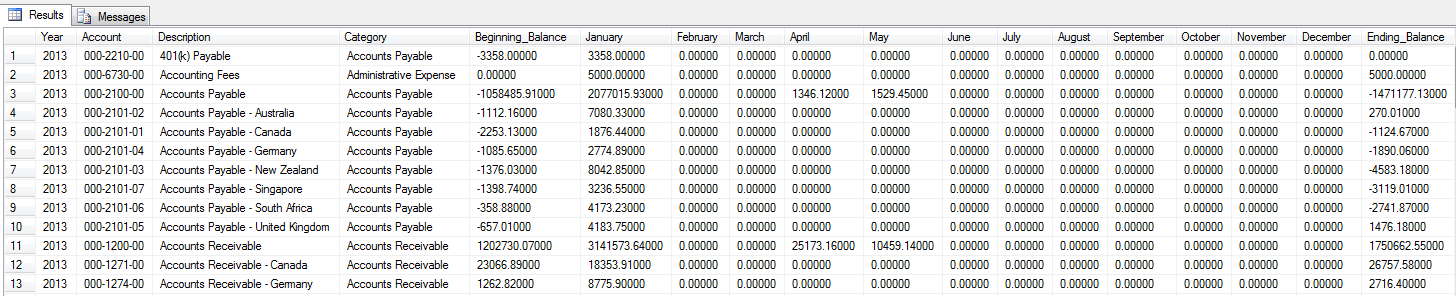
Although the table above contains the datasets I desired, the formatting of the data would require Power BI to perform row level aggregation and unnecessary data manipulation in a SQL view to produce dashboard visualizations that made sense to the end user. Instead, it would be more efficient and user-friendly to retain data structures from Dynamics GP and perform the aggregations within SQL views on the backend, as opposed to making Power BI and its end users do the work on the front end.
When attempting to write a SQL view to perform the aggregations, the first issue I ran into was that not all ending balances for accounts are calculated the same. For example, all income statement accounts are to be calculated starting at $0.00 on the first day of the fiscal year; whereas balance sheet accounts have rolling balances from year to year. To further complicate our scenario, account specific information, which is normally available in the Dynamics GP table, was not in their system—it was provided to us as a separate flat file. In this scenario, the relevant account information (balance sheet and non-balance sheet) was included in the AccountType column within the separate flat file.
With this knowledge, I created a SQL view and divided it into two parts: balance sheet and non-balance sheet accounts.
SQL used to create my STG view:
The first part of the view is a common table expression (CTE) that calculates the cumulative balance of all non-balance sheet accounts. This CTE was broken into two parts to get both current and historical accounts summary information. To arrive at the cumulative balance, I performed a windowing function SUM on the Dynamics GP field PERDBLNC, with a partition by ACTINDX and year being ordered by period. As a result, when the user filters on period 12 (final period of the year), the dashboard displays the cumulative balance. Noting that PERIODID = 0 is used for balance sheet accounts, which Dynamics GP stores the previous year balance, I chose to filter out all period 0’s and any balance sheet account types for this CTE.
STG View Part 1: Non-Balance Sheet Aggregation
CREATE VIEW [STG].[v_Fact_GLSnapshot] AS
WITH CumulativeBalance_CTE AS (
–All non balance sheet
Click to view full SQL
SELECT
LTRIM(RTRIM(AIM.ACTNUMST)) AS AccountNumber,
AIM.ACTINDX,
RTRIM(ACSM.YEAR1) AS FiscalYear,
CASE WHEN ACSM.PERIODID = 0
THEN DATEFROMPARTS(RTRIM(ACSM.[YEAR1])-1,12,31)
ELSE DATEFROMPARTS(RTRIM(ACSM.[YEAR1]),ACSM.[PERIODID],1)
END AS PeriodStartDate,
ACSM.DEBITAMT AS DebitAmount,
ACSM.CRDTAMNT AS CreditAmount,
ACSM.PERIODID,
ACSM.PERDBLNC,
SUM(ACSM.PERDBLNC) OVER (PARTITION BY ACSM.ACTINDX, YEAR1 ORDER BY ACSM.PERIODID ASC) AS CumulativeBalance
FROM GL10110 AS ACSM –Account Current Summary Master
LEFT JOIN GL00105 AS AIM –Account Index Master
ON ACSM.ACTINDX = AIM.ACTINDX
LEFT JOIN ChartOfAccounts COA –Chart Of Accounts Flat File
ON AIM.ACTNUMST = COA.Account
WHERE COA.AccountType != ‘Balance Sheet’
AND ACSM.PERIODID != 0
UNION
SELECT
LTRIM(RTRIM(AIM.ACTNUMST)) AS AccountNumber,
AIM.ACTINDX,
RTRIM(ASH.YEAR1) AS FiscalYear,
CASE WHEN ASH.PERIODID = 0
THEN DATEFROMPARTS(RTRIM(ASH.[YEAR1])-1,12,31)
ELSE DATEFROMPARTS(RTRIM(ASH.[YEAR1]),ASH.[PERIODID],1)
END AS PeriodStartDate,
ASH.DEBITAMT AS DebitAmount,
ASH.CRDTAMNT AS CreditAmount,
ASH.PERIODID,
ASH.PERDBLNC,
SUM(ASH.PERDBLNC) OVER (PARTITION BY ASH.ACTINDX, YEAR1 ORDER BY ASH.PERIODID ASC) AS CumulativeBalance
FROM GL10111 AS ASH –Account Summary History
LEFT JOIN GL00105 AS AIM –Account Index Master
ON ASH.ACTINDX = AIM.ACTINDX
LEFT JOIN ChartOfAccounts COA –Chart Of Accounts Flat File
ON AIM.ACTNUMST = COA.Account
WHERE COA.AccountType != ‘Balance Sheet’
AND ASH.PERIODID != 0
),
The second part of the view is a CTE to calculate the cumulative balance for balance sheet accounts. Almost the same calculations noted above are being performed in this CTE; however, I am no longer excluding PERIODID = 0, because this period contains the cumulative balance of the previous year and is needed in the current year calculation. Additionally, this CTE is filtered to only include account types defined as balance sheet.
STG View Part 2: Balance Sheet Aggregation
CumulativeBalance_CTE2 AS (
–All balance sheet
Click to view full SQL
SELECT
LTRIM(RTRIM(AIM.ACTNUMST)) AS AccountNumber,
AIM.ACTINDX,
RTRIM(ACSM.YEAR1) AS FiscalYear,
CASE WHEN ACSM.PERIODID = 0
THEN DATEFROMPARTS(RTRIM(ACSM.YEAR1)-1,12,31)
ELSE DATEFROMPARTS(RTRIM(ACSM.YEAR1),ACSM.[PERIODID],1)
END AS PeriodStartDate,
ACSM.DEBITAMT AS DebitAmount,
ACSM.CRDTAMNT AS CreditAmount,
ACSM.PERIODID,
ACSM.PERDBLNC,
SUM(ACSM.PERDBLNC) OVER (PARTITION BY ACSM.ACTINDX, YEAR1 ORDER BY ACSM.PERIODID ASC) AS CumulativeBalance
FROM GL10110 AS ACSM –Account Current Summary Master
LEFT JOIN GL00105 AS AIM –Account Index Master
ON ACSM.ACTINDX = AIM.ACTINDX
LEFT JOIN ChartOfAccounts COA –Chart of Accounts Flat File
ON AIM.ACTNUMST = COA.Account
WHERE COA.AccountType = ‘Balance Sheet’
UNION
SELECT
LTRIM(RTRIM(AIM.ACTNUMST)) AS AccountNumber,
AIM.ACTINDX,
RTRIM(ASH.YEAR1) AS FiscalYear,
CASE WHEN ASH.PERIODID = 0
THEN DATEFROMPARTS(RTRIM(ASH.YEAR1)-1,12,31)
ELSE DATEFROMPARTS(RTRIM(ASH.YEAR1),ASH.[PERIODID],1)
END AS PeriodStartDate,
ASH.DEBITAMT AS DebitAmount,
ASH.CRDTAMNT AS CreditAmount,
ASH.PERIODID,
ASH.PERDBLNC,
SUM(ASH.PERDBLNC) OVER (PARTITION BY ASH.ACTINDX, YEAR1 ORDER BY ASH.PERIODID ASC) AS CumulativeBalance
FROM GL10111 AS ASH –Account Summary History
LEFT JOIN GL00105 AS AIM –Account Index Master
ON ASH.ACTINDX = AIM.ACTINDX
LEFT JOIN ChartOfAccounts COA –Chart of Accounts Flat File
ON AIM.ACTNUMST = COA.Account
WHERE COA.AccountType = ‘Balance Sheet’
)
The final part of the view is to combine the above two CTEs while also adding: an Active column, ISNULL to PeriodEndBalance, and PeriodBeginBalance.
STG View Part 3: Non-Balance Sheet & Balance Sheet Union
SELECT
CBAL.FiscalYear,
Click to view full SQL
CBAL.PERIODID AS FiscalPeriod,
CBAL.PeriodStartDate,
CBAL.AccountNumber,
CBAL.DebitAmount,
CBAL.CreditAmount,
CASE WHEN AM.ACTIVE = 1 THEN ‘Yes’
WHEN AM.ACTIVE = 0 THEN ‘No’
ELSE ‘Default’
END AS Active
,ISNULL(CBAL.CumulativeBalance,0) AS PeriodEndBalance
,ISNULL(CBAL.CumulativeBalance,0) – CBAL.PERDBLNC AS PeriodBeginBalance
,CBAL.PERDBLNC AS PeriodNetChange
FROM CumulativeBalance_CTE CBAL –CTE
LEFT JOIN GL00100 AS AM –Account Master
ON CBAL.ACTINDX = AM.ACTINDX
UNION ALL
SELECT
CBAL2.FiscalYear,
CBAL2.PERIODID AS FiscalPeriod,
CBAL2.PeriodStartDate,
CBAL2.AccountNumber,
CBAL2.DebitAmount,
CBAL2.CreditAmount,
CASE WHEN AM.ACTIVE = 1 THEN ‘Yes’
WHEN AM.ACTIVE = 0 THEN ‘No’
ELSE ‘Default’
END AS Active
,ISNULL(CBAL2.CumulativeBalance,0) AS PeriodEndBalance
,ISNULL(CBAL2.CumulativeBalance,0) – CBAL2.PERDBLNC AS PeriodBeginBalance
,CBAL2.PERDBLNC AS PeriodNetChange
FROM CumulativeBalance_CTE2 CBAL2 –CTE2
LEFT JOIN GL00100 AS AM –Account Master
ON CBAL2.ACTINDX = AM.ACTINDX
GO
It’s a hefty query, but once executed, the resulting view provides me with all the columns I want. Here’s an example output for a non-balance sheet and balance sheet account:
STG View Part Output Example
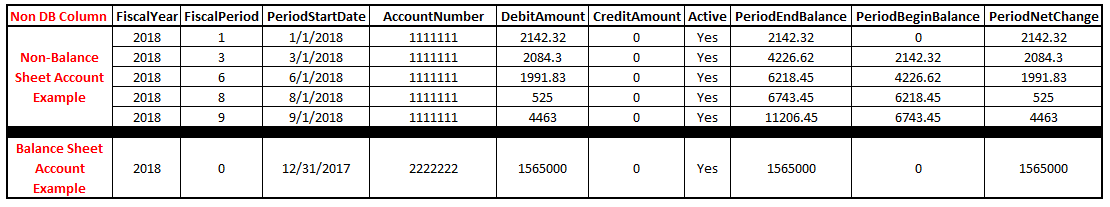
The Issue: Missing Periods
The query works great for the non-balance sheet and balance sheet calculations; however, now we see that the accounts have missing period information for 2, 4, 5, 7, 10, 11, and 12 (on non-balance sheet account) and 1-12 (on the balance sheet account). In this example, we need period 12 because we want Power BI to filter on that period to get the GL account summary for the year. After digging, I found that periods do not exist in Dynamics GP when there is no account activity for the period.
To work around this Dynamics GP feature, I added two SQL queries that will execute in the ETL process I have in place to load the staging table from the view.
1.) The first query is related to non-balance sheet accounts. The query will search for any accounts that do not have a period 12, then roll up the most recent period and create a period 12 with the most recent period end balance. This ensures when Power BI is looking at period 12 for the year summary all accounts will be included even if they had no activity in period 12.
ETL Query #1: Non-Balance Sheet Missing Period 12
with
CTE1 as
(SELECT
Click to view full SQL
AccountNumber,
FiscalYear,
MAX(FiscalPeriod) as LatestPeriod
FROM STG.t_Fact_GLSnapshot
GROUP BY AccountNumber, FiscalYear
),
CTE2 AS
(SELECT
GLSnapshotID,
AccountNumber,
FiscalYear,
FiscalPeriod,
PeriodEndBalance,
PeriodStartDate,
DebitAmount,
CreditAmount,
Active,
PeriodBeginBalance,
PeriodNetChange,
FROM STG.t_Fact_GLSnapshot CTE2
),
CTE3 as
(SELECT
CTE2.GLSnapshotID,
COA.PillarGroup,
CTE1.AccountNumber,
CTE1.FiscalYear,
CTE1.LatestPeriod,
CTE1.PeriodEndBalance,
CTE1.PeriodStartDate,
CTE1.DebitAmount,
CTE1.CreditAmount,
CTE1.Active,
CTE1.PeriodBeginBalance,
CTE1.PeriodNetChange,
FROM CTE1
LEFT JOIN CTE2
ON CTE1.AccountNumber = CTE2.AccountNumber
AND CTE1.FiscalYear = CTE2.FiscalYear
AND CTE1.LatestPeriod = CTE2.FiscalPeriod
LEFT JOIN ChartOfAccounts COA
ON CTE2.AccountNumber = COA.Account
WHERE CTE1.LatestPeriod != ’12’
AND COA.PillarGroup != ‘Balance Sheet’
)
Insert Into STG.t_Fact_GLSnapshot
(GLSnapshotID,
FiscalYear,
FiscalPeriod,
PeriodStartDate,
AccountNumber,
DebitAmount,
CreditAmount,
Active,
PeriodEndBalance,
PeriodBeginBalance,
PeriodNetChange,
DataSourceID,
STGLoadDateUTC,
AuditBatchLoadID)
SELECT
GLSnapshotID
FiscalYear,
’12’ as FiscalPeriod,
PeriodStartDate,
AccountNumber,
DebitAmount,
CreditAmount,
Active,
PeriodEndBalance,
PeriodBeginBalance,
PeriodNetChange,
FROM CTE3
2.) The second query is related to balance sheet accounts. The query will search for any accounts that do not have a period 12, then will update the period net change as a 0 in the created period 12. This is needed because balance sheet accounts have a rolling balance from year to year, and the period net change will affect the balance total in future years. As such, the period net change for the created period 12 is to be 0, accurately reflecting the actual net change for those periods when there was no activity.
ETL Query #2: Balance Sheet Missing Period 12
with
CTE1 as
(SELECT
Click to view full SQL
AccountNumber,
FiscalYear,
MAX(FiscalPeriod) as LatestPeriod
FROM STG.t_Fact_GLSnapshot
GROUP BY AccountNumber, FiscalYear
),
CTE2 AS
(SELECT
GLSnapshotID,
AccountNumber,
FiscalYear,
FiscalPeriod,
PeriodEndBalance,
PeriodStartDate,
DebitAmount,
CreditAmount,
Active,
PeriodBeginBalance,
PeriodNetChange,
FROM STG.t_Fact_GLSnapshot CTE3
),
CTE3 as
(SELECT
CTE2.GLSnapshotID,
COA.PillarGroup,
CTE1.AccountNumber,
CTE1.FiscalYear,
CTE1.LatestPeriod,
CTE2.PeriodEndBalance,
CTE2.PeriodStartDate,
CTE2.DebitAmount,
CTE2.CreditAmount,
CTE2.Active,
CTE2.PeriodBeginBalance,
CTE2.PeriodNetChange,
FROM CTE1
LEFT JOIN CTE2
ON CTE1.AccountNumber = CTE2.AccountNumber
AND CTE1.FiscalYear = CTE2.FiscalYear
AND CTE1.LatestPeriod = CTE2.FiscalPeriod
LEFT JOIN ChartOfAccounts COA
ON CTE2.AccountNumber = COA.Account
WHERE CTE1.LatestPeriod != ’12’
AND COA.PillarGroup = ‘Balance Sheet’
)
Insert Into STG.t_Fact_GLSnapshot
(GLSnapshotID,
FiscalYear,
FiscalPeriod,
PeriodStartDate,
AccountNumber,
DebitAmount,
CreditAmount,
Active,
PeriodEndBalance,
PeriodBeginBalance,
PeriodNetChange)
SELECT
GLSnapshotID,
FiscalYear,
’12’ as FiscalPeriod,
PeriodStartDate,
AccountNumber,
DebitAmount,
CreditAmount,
Active,
PeriodEndBalance,
PeriodBeginBalance,
0.00 as PeriodNetChange,
FROM CTE4
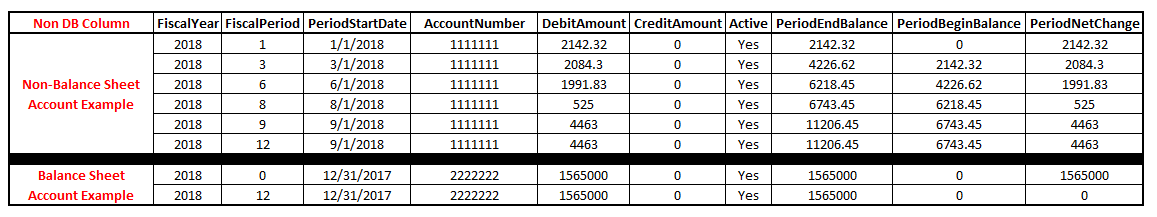
After executing the above view and two insert queries during the ETL process, we get a more complete table with period 12 now accounted for (since there is no change over periods that do not exist, I chose to not worry about those and only focus on period 12 for purposes of the dashboard):
Post ETL Table Output Example
Changing Negative Values to Positives
There is one more cosmetic change I wanted to make for the BI dashboard to display the data more clearly. I noticed for all accounts that are increased in Dynamics GP by a credit, they show up as a negative value which could make for a confusing dashboard. To reflect these accounts as positive values, I created another view and added a calculation to the PeriodEndBalance and PeriodBeginBalance. This calculation multiples the total value by “-1” for any liability, retained earnings, and revenue account types. See below for the query I used in this view.
Final Table Cosmetic Changes
CREATE VIEW [FACT].[v_GLSnapshot] AS
Click to view full SQL
SELECT
GLS.FiscalYear,
GLS.FiscalPeriod,
GLS.PeriodStartDate,
GLS.AccountNumber,
(GLS.DebitAmount) AS DebitAmount,
(GLS.CreditAmount) AS CreditAmount,
CASE WHEN COA.AccountType IN (‘Liability’,‘Retained Earnings’,‘Revenue’)
THEN -1.0 * (GLS.PeriodEndBalance)
ELSE GLS.PeriodEndBalance
END AS PeriodEndBalance,
CASE WHEN COA.AccountType IN (‘Liability’,‘Retained Earnings’,‘Revenue’)
THEN -1.0 * (GLS.PeriodBeginBalance)
ELSE (GLS.PeriodBeginBalance)
END AS PeriodBeginBalance,
(GLS.PeriodNetChange) AS PeriodNetChange
FROM STG.t_Fact_GLSnapshot GLS
LEFT JOIN ChartOfAccounts COA
ON GLS.AccountNumber = COA.AccountNumber
Loading a Well-Designed Table for an Intuitive Data Visualization
From this view, we’re ready to load the table into our BI dashboard. Once loaded, we set the filter to Period 12, and the summary total for all accounts (balance sheet and income statement) are accurately presented. In the below example, you can clearly see revenue, expense, and retained earning account types, and the values are all positive.
Final Data Visualization with Optimized Data Load
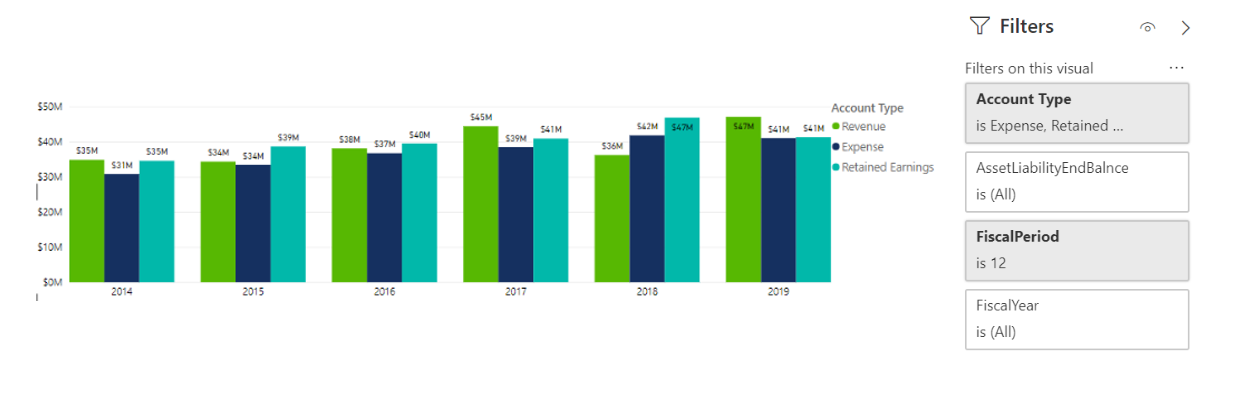
No aggregations were performed in PowerBI to create this dashboard, and only one filter is needed. If the original Standard GL Trial Balance table above was loaded, Power BI would have had to aggregate the data, and multiple filters would have been necessary to arrive at such an intuitive dashboard. In this case, with a simple Period filter set to 12, we see GL account totals for the year.
We created an optimized GL account summary table for Power BI, and our client now has the visuals they need to quickly understand their financials and make timely business decisions. I hope this helps anyone running into issues when creating a GL account summary table in Dynamics GP. Please share other effective approaches you may have used!
Need help with software evaluation and selection?
With the analytics industry changing at such a rapid pace, we know it’s a challenge to keep up with new features and technologies. As data and analytics consultants, we have experience with a wide range of BI products and can help you cut through the noise to determine which tools can solve the problems you’re facing.